Image Histogram Equalization Overview
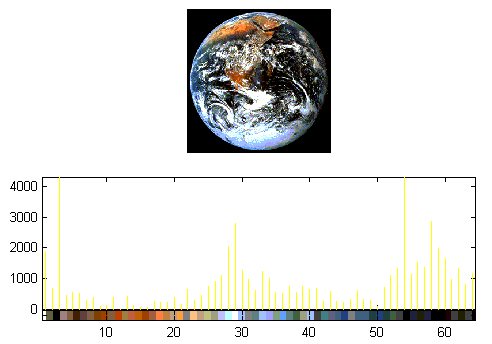
The histogram of an image represents
the relative frequency of occurrence of the various gray levels in the
image. Below you can see the histograms of two images: one colored and
the other black and white. For black and white images we shall have 256
gray levels, from 0 up to 255, and the vertical lines in the histogram
indicate how many pixels in an image assume a particular gray level. In
this experiment we deal only with black and white images.


A black and white image is represented by a two-dimensional
array of numbers (or matrix), x(m,n), with values ranging
from 0 to 255. A black pixel assumes the value x(m,n)=0
while a white pixel assumes the value x(m,n)=255. All other
levels in between are assigned linearly to contrasts between the black
and white extremes.
By examining the histogram of the white and black image above, we see
that its pixels assume gray levels that are concentrated in a relatively
narrow interval, say approximately in the interval 70-170. The narrow histogram
is a consequence of the fact that the image does not use evenly all the
gray levels in the range [0,255].
Histogram euqalization is a technique that allows us to improve
the contrast of images with such narrow histograms and it has been found
to be a powerful technique in image enhancement. This technique does not
change the values contained in the matrix x(m,n) that represents
the image. Instead, it modifies the color mapping associated with
the values of the matrix x(m,n) so that we tend to use evenly every
color in the full dynamic range [black to white].
For example, for the black and white image above, we would map all pixels
with values smaller than 70 to black and all those with values above 170
to white. All values in between, i.e., in the range 70-170, will now be
mapped to the remaining colors evenly. You can see below the effect of
this technique on the previous image. Observe in particular that the histogram
didnot change and that only the color mapping changed.

For the sake of illustration, and only as an example, assume we have a
5x5 image whose pixels assume values between 0 and 13. Assume further
that we only have five gray levels, say corresponding to the colors Black
(B), Brown (BR), Gray (G), Light Blue (LB), and White (W). Pixels
are mapped to these gray levels according to the rule:
0-2 ----- B (Black)
3-5 ----- BR (Brown)
6-8 ----- G (Gray)
9-11 ----- LB (Light Blue)
12-13 ----- W (White)
Assume the image is such that its pixels assume values between 7 and 9
only. Then we can assign all pixels below 7 to Black and all pixels above
9 to White. The values in between (7,8,9) can be distributed evenly among
the remaining gray levels, say:
0-6 ----- B
(Black)
7 ----- BR
(Brown)
8 ----- G
(Gray)
9 ----- LB
(Light Blue)
10-13 ----- W (White)