MOTIVATION
Perceiving speech in an acoustically noisy environment requires intelligent use of redundant multi-dimensional cues spread over wide-ranging time scales. Speech perception research has often focused on spectral cues (from approximately 400-8000 Hz) that are available through a critical-band filtering mechanism. This approach is currently used in most automatic speech recognition (ASR) systems, together with a hierarchy of non-stationary stochastic models operating at the progressively slower rates of: the speech-frame, phoneme, word, phrase and even sentence. More recently, speech perception research has also investigated the role of temporal amplitude-modulation cues (1) at the syllabic- or articulator-rate of approximately 2-20 Hz, with some application to ASR (2). The current study examines the perception of pitch-rate amplitude-modulation cues associated with vocal fold vibration at roughly 80-300 Hz. This dimension is ignored in most ASR systems and in some speech perception studies. The strident fricatives [s z] are used as a case study.
SPEECH ANALYSIS
Fricatives are produced by forming a sufficiently narrow constriction in the vocal tract to generate a turbulent noise-like source. With voiced fricatives, vibrating vocal folds introduce low-frequency energy at the first few harmonics of the fundamental frequency. Measurements using the relative level of the first harmonic have been shown to be good indicators for voiced/unvoiced fricative distinctions (3)(4). In the current study, the fricatives [s z] with the vowels [a i u] were recorded as CV syllables from four talkers. Figure 1 compares log-magnitude spectral estimates for [s] and [z] averaged over 96 measurements.

FIGURE 1: Mean spectral estimates for [s] and [z] (N=96).
A typical ASR system relies on the low-frequency spectral difference to discriminate these sounds. However, Figure 2 shows examples of the temporal waveform for [z] and [s] after each has been high-pass filtered above 3 kHz. These waveforms provide evidence that during voiced fricatives, the vibrating vocal folds can modulate the pressure source behind the constriction sufficiently to generate an acoustic pitch-rate amplitude-modulation cue in high-frequency regions. Perceptual discrimination thresholds were measured for these isolated high-pass tokens in a flat background noise (see Figure 3B). Four subjects participated in the measurements.

FIGURE 2: Temporal waveforms of [z] and [s] after high-pass filtering.
MODELING AMPLITUDE MODULATION PERCEPTION
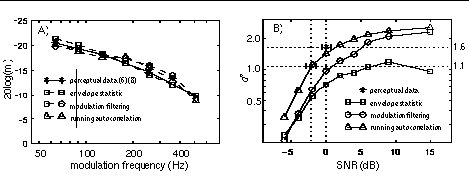
The perceptual sensitivity to this amplitude-modulation cue was analyzed using three psychoacoustic models. The first is an envelope-statistic model, adapted from (5)(6), that uses a 3-kHz bandwidth filter, half-wave rectification, 90-Hz low-pass filtering, and a normalized fourth-moment statistic. The second, adapted from (7)(8), uses 6 4th-order gamma-tone filters (from roughly 4.5 to 7.5 kHz), half-wave rectification, 1-kHz low-pass filtering, modulation filtering with a Q3dB of 2, internal noise, and a standard deviation statistic. The third, motivated by (9)(10)(11), uses the same 6 filters, half-wave rectification, 280-Hz low-pass filtering, and then computes the running autocorrelation in each channel. The channel-autocorrelations are summed across the 6-channels to generate a summary autocorrelogram. The model's statistic is the peak difference between any two summary autocorrelogram values at delays of t and t/2. Figure 3A shows each model's prediction of temporal modulation transfer functions (5)(perceptual data is an interpolated average from (6) and (8)). Figure 3B shows [s z] discrimination predictions for each model, together with perceptual thresholds tracked at two d' values. The third model's predictions best approximate the perceptual discrimination of high-pass filtered [s] and [z] in noise. [Work supported by NIDCD grant #DC02033 and the NSF.]

FIGURE 3: A) Temporal modulation transfer functions (m=modulation depth). B) Discriminating [s] and [z] in noise.
REFERENCES
- Shannon, R.V., Zeng, F.G., Kamath, V., Wygnoski, J. and Ekelid, M., Science 270, 303-304 (1995).
- Hermansky, H. and Morgan, N., IEEE Trans. on Speech and Audio Proc. 2, 578-589 (1994).
- Stevens, K.N., Blumstein, S.E., Glicksman, L., Burton, M. and Kurowski, K., J. Acoust. Soc. Am. 91, 2979-3000 (1992).
- Pirello, K., Blumstein, S.E. and Kurowski, K., J. Acoust. Soc. Am. 101, 3754-3765 (1997).
- Viemeister, N.F., J. Acoust. Soc. Am. 66, 1364-1380 (1979).
- Strickland, E.A. and Viemeister, N.F., J. Acoust. Soc. Am. 102, 1799-1810 (1997).
- Dau, T., Kollmeier, B. and Kohlrausch, A., J. Acoust. Soc. Am. 102, 2892-2905 (1997).
- Dau, T., Kollmeier, B. and Kohlrausch, A., J. Acoust. Soc. Am. 102, 2906-2919 (1997).
- Licklider, J.C.R., Experientia 7, 128-134 (1951).
- Lyon, R.F., Proc. of the IEEE ICASSP, San Diego, CA, 36.1.1-4, 1984.
- Meddis, R. O'Mard, L., J. Acoust. Soc. Am. 102, 1811-1820 (1997).